Company profile
Perennial Real Estate Holdings Limited (“Perennial”; Bloomberg ticker: PREH SP Equity) is an integrated real estate owner and developer, holding a diversified portfolio of assets including offices, retail spaces and healthcare properties (see Table 1). In terms of its geographical exposure, Perennial has increasingly shifted its growth focus to China, while holding stabilised assets in Singapore to generate recurring income. As at 31 Dec 19, real estate assets in China comprised of 68.5% of its total assets, while Singapore properties made up 24.3%.
Table 1: Valuation of Perennial’s properties as at 31 Dec 19
|
Properties |
Stake held by Perennial (%) |
Valuation on a 100% basis as at 31 Dec 19 (in millions) |
|
Beijing Tongzhou Integrated Development Phase 1 (Plots 14-1 & 14-2) |
40 |
RMB 5,619 |
|
Chengdu East High Speed Railway Integrated Development Plot D2 |
50 |
RMB 2,512 |
|
Kunming South HSR International Healthcare and Business City (Plots A1 & A2) |
45 |
RMB 595 |
|
Perennial International Health and Medical Hub, Chengdu |
80 |
RMB 3,950 |
|
Perennial Jihua Mall, Foshan |
100 |
RMB 950 |
|
Perennial Qingyang Mall, Chengdu |
100 |
RMB 1,350 |
|
Shenyang Longemont Offices |
50 |
RMB 2,224 |
|
Shenyang Longemont Shopping Mall |
50 |
RMB 3,763 |
|
Shenyang Red Star Macalline Furniture Mall |
50 |
RMB 2,453 |
|
Tianjin South HSR International Healthcare and Business City (Plots 8, 9 & 11) |
45 |
RMB 795.4 |
|
Xi’an North High Speed Railway Integrated Development Plot 4 |
51* |
RMB 1,272 |
|
AXA Tower, Singapore |
31.2** |
S$ 132.3 |
|
Capitol Singapore |
100*** |
S$ 502.7 |
|
CHIJMES, Singapore |
51.6 |
S$ 334 |
|
*Relates to non-hotel component **Relates to retail and medical components ***Excluding Eden Residences Capitol and The Capitol Kempinski Hotel Singapore Source: Company |
||
The group is listed on the SGX Mainboard since 2014 and sported a market cap of S$549.5m at the close of yesterday. There are 4 key sponsors who collectively own 82.4% of Perennial, namely group chairman Mr Kuok Khoon Hong (36.5%), Mr Ron Sim (15.5%), CEO of V3 Group Limited, SGX-listed Wilmar International Limited (20.0%) and Perennial’s CEO Mr Pua Seck Guan (10.4%). Mr Kuok and Mr Pua are also respectively the CEO and COO of Wilmar International Limited (“Wilmar”).
2019 results
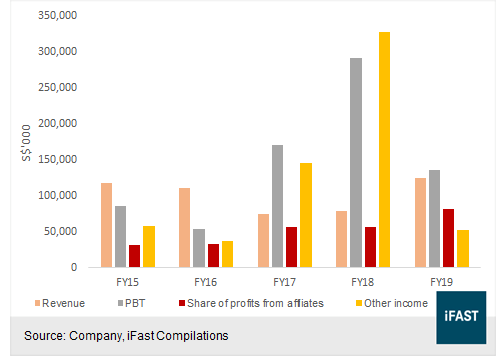
Thanks to higher revenue contributions from Capitol Singapore and Perennial International Health and Medical Hub (“PIHMH”), Perennial’s revenue climbed 58.7% YoY to S$124.2m. While revenue improved, profitability weakened with gross profit margin lower at 38.2% (2018: 39.3%).
Other income, which comprised of mainly fair value and divestment gains, fell 84.2% YoY to S$51.9m in FY19. Other income was significantly higher last year mainly due to two land plots on Beijing Tongzhou Integrated Development Phase 1 being reclassified from development properties to investment properties.,
On the other hand, share of results of associates and joint ventures (“JVs”) jumped 43.8% YoY to S$80.9m, on the back of divestment gain from Chinatown Point (disposed in 2Q19), higher fair value gains of projects in China and improved performance from healthcare associated companies.
Together, other income and share of results of associates and JVs constituted a substantial portion of Perennial’s earnings before interest and taxes (“EBIT”), which came in at S$136.0m in 2019 (2018: S$376.2m). Meanwhile, finance costs rose 28.4% YoY to S$124.4m due to higher interest rates and additional loans drawn down to fund new investments during the year. Interest coverage (EBIT over interest expense) consequently fell from 3.9x in 2018 to 1.1x in 2019.
EBIT contributions from other income and share of results of associates and JVs often exceed Perennial’s gross profit, indicating that the group has a high reliance on these two income sources. We think it also indicates that Perennial will have to monetize its assets to support its debt servicing capability. Notably, excluding other income and share of results of associates and JVs, Perennial’s EBIT would be insufficient to cover its finance costs of S$124.4m for the year.
Figure 1: Other income and contributions from associates and JVs are sizeable relative to revenue
Associates and joint ventures
Associates and JVs accounted for 29.8% (4Q18: 32.5%) of Perennial’s total assets as at 31 Dec 19. To reiterate, these companies are significant contributors to Perennial’s earnings and account for a substantial amount of the group’s portfolio of properties as shown in Table 1. In 2019, the carrying amount of interests in associates and JVs fell to S$2.3 billion (4Q18: S$2.5 billion), which we think largely reflected the divestment of entire stakes in Chinatown Point and United Engineers Limited (“UEL”).
Most of Perennial’s associates and JVs (see Table 2) are in China. These companies have yet to contribute positively to Perennial’s earnings as their projects are still under development (see Table 3).
Table 2: Perennial’s associates and joint ventures
|
Associate/ joint venture |
% stake held by Perennial as at 2018 |
2018 income attributable to Perennial (S$m) |
2018 carrying amount (S$m) |
2017 carrying amount (S$m) |
|
Nation Mind Development Ltd |
30 |
1.8 |
98.3 |
96.5 |
|
Perennial Tongzhou Holdings Pte Ltd |
46.6 |
-7.1 |
272.9 |
279.9 |
|
Perennial Shenton Investors Pte Ltd |
31.2 |
0.63 |
138.5 |
137.8 |
|
Perennial Somerset Investors Pte Ltd |
30 |
0.06 |
118.7 |
118.6 |
|
Chengdu Huifeng Commercial Real Estate Co., Ltd |
50 |
-4.7 |
175.2 |
179.9 |
|
Chengdu Changfeng Real Estate Development Co., Ltd |
50 |
-5.1 |
182.3 |
187.4 |
|
Shenyang Summit Real Estate Development Co., Ltd |
50 |
-8.5 |
762.1 |
770.6 |
|
Perennial HC Holdings Pte Ltd |
45 |
0.38 |
85.2 |
- |
|
Non-material associates and joint ventures |
- |
-4.2 |
84.4 |
82.0 |
|
Total |
- |
-26.7 |
1,917.6 |
1,852.7 |
|
Source: Company, iFAST estimates Note: excluding disposed interests during FY19 (Chinatown point and UEL), also excludes Capitol Singapore where Perennial’s stake has increased to more than 50%. |
||||
Given Perennial’s aggressive plans to build up its China operations, we expect the group to continue to deploy capital into this region, particularly for its high speed railway (“HSR”) integrated developments. On 26 Feb 20, the group announced that its wholly-owned subsidiary, Perennial Xi’an Development 1 Pte Ltd, acquired an additional 14.7% stake in Xi’an Perennial Chengtou West Real Estate Co., Ltd (“Xi’an Perennial West”) to increase its stake to 65.7%. The acquisition came with a price tag of RMB190m (~S$36.7m), funded via a mixture of internal cash and bank loans. Xi’an Perennial West is developing Perennial’s second HSR healthcare integrated mixed-use development, the Xi’an North HSR Integrated Development.
Meanwhile, Perennial also commenced the development of Perennial Tianjin South HSR International Healthcare and Business City in December. The project has a gross floor area of about 307,500 square metres (“sqm”). Other HSR integrated development projects include Perennial Kunming South HSR International Healthcare and Business City.
Besides China, Perennial on 31 Jan 20 announced the setup of a joint-venture company named Perennial CBL Pte Ltd (“Perennial CBL”) for the undertaking of a development project in Sri Lanka. The group will hold an effective stake of 31.25% in Perennial CBL, which in turn will own an 80% interest in Perennial Real Estate Lanka (Private) Ltd. The JV will acquire and develop a 14,000-sqm land parcel in Colombo, Sri Lanka, into a mixed-use development (comprising of residential, office and retail components) spanning a total gross floor area of 120,000 sqm. Perennial expects to contribute USD17.5m (~S$23.6m) to the JV, which will be funded by a combination of cash, sales of property units and bank borrowings.
We note that a number of Perennial’s JVs and associates involve its sponsors, in particular Mr Kuok and his related entities, as the company’s investment partners. Hence, we think Perennial will likely remain as a key vehicle for its sponsors to invest in the property and healthcare sector. We also see this as a sign of strong alignment of interests between Perennial and its sponsors, and higher likelihood of sponsor support in times of need. Based on disclosures in Perennial’s 2018 annual report, interested person transactions pertaining to entry into JVs with Mr Kuok, Wilmar and their associates, amounted to S$302.4m (2017: S$296.1m).
The sponsors have also demonstrated their support through their investments in Perennial’s bonds. As at 31 Dec 18, Mr Kuok had deemed interest in S$33.7m of the S$280m PREHSP 4.550% 29Apr2020 Corp (SGD) - Retail, S$30m of the S$180m PREHSP 5.950% 28Aug2020 Corp (SGD), S$50m of the S$120m PREHSP 3.900% 12Jan2021 Corp (SGD) and S$29.25m of the S$100m PREHSP 3.850% 03Jul2020 Corp (SGD). Mr Sim and Mr Pua also hold S$10m and S$5m of the PREHSP 5.95% ‘20s respectively.
Credit highlights
As at 31 Dec 19, Perennial has a debt load of S$2.97 billion, up slightly from S$2.94 billion in 4Q18. Meanwhile, proceeds from disposal of an associate (most likely the stake in UEL) and distribution from an associate arising from gain on disposal of its subsidiaries, helped to lift cash balance higher from S$76.8m to S$119.8m over the same period. Net gearing as measured by net debt over total equity therefore stably maintained at 0.74x (4Q18: 0.72x). Assuming Perennial funds its acquisition of stakes in Xi’an Perennial West and Perennial CBL fully by debt, we estimate that net gearing would inch higher to ~0.76x.
We see significant liquidity risk given Perennial’s short-term obligations of S$1.30 billion (43.7% of total debt). Even if we assume the company is able to refinance all S$105.9m of secured short-term debt, the remaining amount of S$1.19 billion in current borrowings are still hefty. The short-term debt includes the S$280m PREHSP 4.550% 29Apr2020 Corp (SGD) - Retail, S$100m PREHSP 3.850% 03Jul2020 Corp (SGD) and $180m PREHSP 5.950% 28Aug2020 Corp (SGD).
While Perennial faces a high refinancing wall, the company has several assets that can potentially be monetised for debt repayment (see Figure 2). These properties include Perennial’s 31.2% stake in AXA Tower, 51.6% stake in CHIJMES, Capitol Singapore, Perennial Qingyang Mall and Perennial Jihua Mall. We list Perennial’s property assets in Singapore—which we think are easier to be monetized—against its short-term debt in Figure 2.
Figure 2: Perennial’s short-term debt (as at 31 Dec 19) against its Singapore properties
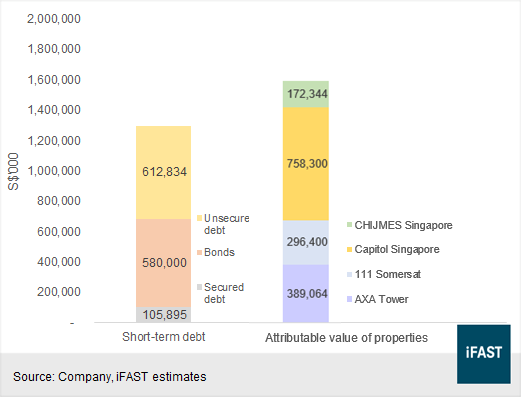
Besides, ongoing sale of units from projects such as 111 Somerset may also help to provide additional liquidity. Overall, we take comfort that Perennial’s asset base primarily comprises of tangible assets, with a manageable debt-to-total asset ratio of 39.3% (4Q18: 38.3%).
In a response to SGX queries regarding its 2019 financial statement, Perennial mentioned that it planned to utilise a combination of unutilised bank facilities, bond issuances and asset divestments to meet its current liabilities. That said, the company has yet to announce any divestment plans subsequently, perhaps because it is holding back divestments in view of the currently weak market sentiment. Other than seeking refinancing through loans and asset monetisation, we think there is a good possibility that Perennial may turn again to its sponsors for financing support, for instance, by anchoring the subscription for a new bond issue.
Overseas projects entail heavy capex
Perennial’s project pipeline (see Table 3), which comprises mostly of China projects, provide good growth prospects. Zhuhai Hengqin Integrated Development is expected to obtain occupation permit in early 2020, and the strata-sale of apartments to be launched by 2Q20 will likely help to provide liquidity.
In Singapore, Perennial is expected to launch the residential project at the former Goodluck Garden site in 2020. Perennial holds a 40% stake in the project, which is jointly developed with Qingjian Realty. The development is expected to comprise of 633 residential units and two commercial units.
While the two projects mentioned above could generate some cash inflows, we note that most of Perennial’s developments, particularly those in China, are likely to incur high capital expenditures given their scale.
Table 3: Perennial’s project pipeline
|
Property |
Location |
Effective Interest (%) |
Expected GFA (million sq ft) |
Target completion |
|
|
Chengdu East HSR Integrated Development |
Chengdu Plot C |
Chengdu, Sichuan province, China |
50.0 |
5.6 |
2022 |
|
Chengdu Plot D1 |
2.4 |
2022 |
|||
|
Chengdu Plot D2 |
3.1 |
2020 |
|||
|
Xi'an North HSR Integrated Development |
Plot 4 |
Xi'an, Shaanxi Province, China |
51.0 |
4.4 |
2021 |
|
Plot 5 |
65.7 |
4.8 |
2024 |
||
|
Tianjin South HSR Integrated Development |
- |
Tianjin, China |
45.0 |
3.3 |
2022 onwards |
|
Kunming South HSR Integrated Development |
- |
Kunming, China |
45.0 |
6.8 |
2023 onwards |
|
Beijing Tongzhou Integrated Development |
Phase 1 |
Beijing, China |
40.0 |
4.5 |
2023 onwards |
|
Phase 2 |
23.3 |
4.0 |
2022 onwards |
||
|
Zhuhai Hengqin Integrated Development |
- |
Zhuhai, Guangdong, China |
20.0 |
2.4 |
2020 |
|
The Light City |
- |
Penang, Malaysia |
50.0 |
4.1 |
2022 |
|
Residential Development |
- |
Jarkarta, Indonesia |
40.0 |
0.3 net sellable area |
2021 onwards |
|
Accra Integrated Development, Ghana |
- |
Ghana, Africa |
55.0 |
1.7 |
2021 |
|
Mixed-use Development |
- |
Mandalay, Myanmar |
50.0 |
0.6 |
construction expected to commence in 1H20 |
|
Mixed-use Development |
- |
Colombo, Sri Lanka |
25.0 |
1.3 |
Site preparation work to commence in 2H20 |
|
Residential Development (formerly Goodluck Garden) |
- |
Singapore |
40.0 |
0.5 |
Expected to launch in 2020 |
|
Source: Company, iFAST compilations |
|||||
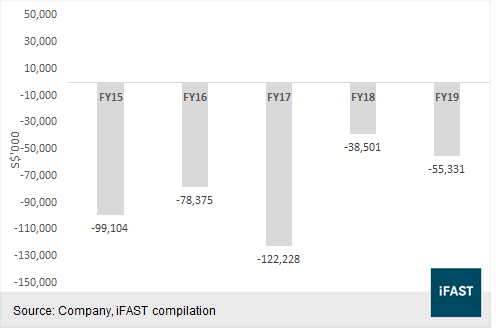
High capex needs may continue to eat into Perennial’s cash flows (see Figure 3). The company ran into another year of negative operating cash flow of S$55.3m in 2019 (2018 net cash used in operating activities: S$33.8m). Meanwhile, Perennial’s current ratio of 0.9x (4Q18: 1.1x), coupled with persistently negative free cash flows, indicate its reliance on external financing. Given the current market environment, Perennial is likely to face challenges in tapping the capital markets.
Figure 3: Net cash used in operating activities
Our take on the Perennial bonds
The Perennial curve (beyond the PREH 4.55% Apr’ 20s) is currently yielding in excess of 9.5% for maturities of less than one year (see Table 4). At the current level of yields, we think the PREHSP bonds offers enticing compensation for Perennial’s tight financial liquidity. At an indicative price of 99.80, the ask YTM of 6.95% (Z-spread: 606bps) on the PREHSP 4.550% 29Apr2020 Corp (SGD) - Retail against its PREH 3.85% Jul’ 20s (Ask YTM: 12.09%) suggested that market is weary of Perennial’s liquidity risk.
Table 4: The Perennial bonds
|
Issues |
Years to maturity |
Ask YTM (%) |
Ask Price |
Z-spread (bps) |
Issue size (S$m) |
|
0.1 |
6.95 |
99.80 |
606 |
280 |
|
|
0.3 |
12.09 |
97.89 |
1,138 |
100 |
|
|
0.4 |
16.15 |
96.01 |
1,548 |
180 |
|
|
0.8 |
9.96 |
95.50 |
923 |
120 |
|
|
*: based on exchange pricing Source: Bloomberg Finance LP, iFAST compilations; data as of 27 Mar 20 |
|||||
Within the PREHSP curve, we are neutral on the PREHSP 3.850% 03Jul2020 Corp (SGD). The PREH 3.85% ’20s are currently indicating at an ask YTM of 12.09%, offering spread of 1138bps above SGD Swaps. However, the indicative pricing may be poorly reflective of actual market prices, given the issue size of S$100m and substantial insider holdings.
We prefer the PREHSP 5.950% 28Aug2020 Corp (SGD) over the PREHSP 3.900% 12Jan2021 Corp (SGD). The PREHSP 5.95% ‘20s are carrying an outsized YTM of 16.15% (Z-spread: 1,548bps), suggesting the market’s expectation of a heightened risk of default. While we agree with the market’s cautious take on Perennial’s credit profile, we are tentatively optimistic that the company would be able to obtain refinancing loans, pursue asset divestments or reach out for financial support from its sponsors in the worst-case scenario.
To reiterate, Perennial will have to address short-term obligations of S$1.3 billion, including the notes maturing this year listed in Table 4. Hence, we think the current inverted curve of Perennial’s bonds reflects the company’s tight liquidity and the bonds’ short maturity.
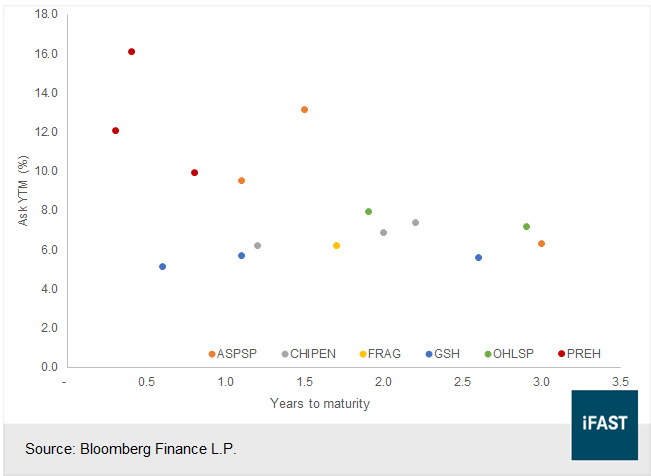
As seen in Figure 4, the Perennial bonds offer some of the highest yields among peer credits. As a reference, Oxley Holdings Limited’s OHLSP 5.700% 31Jan2022 Corp (SGD) and OHLSP 6.500% 28Feb2023 Corp (SGD) are currently yielding 7.93% (Z-spread: 707bps) and 7.19% (Z-spread: 618bps) respectively.
Figure 4: Relative valuation
Declaration:
For specific disclosure, at the time of publication of this report, IFPL (via its connected and associated entities) holds a principal interest in the PREHSP 4.550% 29Apr2020 Corp (SGD) - Retail, OHLSP 6.375% 21Apr2021 Corp (USD), OHLSP 5.150% 18May2020 Corp (SGD) - Retail. The analyst who produces this report own none of the above mentioned securities.